Well, he certainly did not imagine making a nod to Amazon, but that comment is so apt given what Amazon did with its bid on Whole Foods Markets.
Amazon’s acquisition of Whole Foods Markets represents an unprecedented technological investment in the grocery retail industry. The milestone also signals an unprecedented moment for analytics being seen as a catalyst for long-term business value.

This Whole Foods Market in Chicago is bustling with customers. The Amazon acquisition promises to help the chain refine its customer relationship through analytics.
Grocers like Krogers and Safeway have sold food items and associated services with thin profit margins. This meant goods would have to be sold at high volume for a grocery chain to be profitable.
When Whole Foods Market started, however, it developed and maintained a margin advantage over other grocery chains through its focus on offering organic foods. Organic foods command higher prices; thus a high product margin is possible. Whole Foods Market established a strategic advantage with its organic food focus. In fact Whole Foods Market is the first grocer to certify its food as organic according to the Wikipedia page on the company.
In recent years, Wal-Mart and Target have begun to offer grocery, increasing competition against traditional grocery chains. But the most striking tactic has been to offer organic foods alongside those . Wal-Mart and other low-cost grocers drawing customers seeking bargains away from Whole Foods.
The plan has worked. Whole Foods reported six quarters of declining sales as a result. Moreover, Whole Foods gained a consumer nick-name "Whole Paycheck” that references the price concerns people have about its produce.
Amazon has a number of analytic solutions that benefit Amazon Web Services (AWS), a set of cloud and services for databases and hosting. These cloud services have been geared towards either supporting Amazon services or for specific needs of the tech community. But with the Whole Food acquisition, Amazon has an opportunity to demonstrate tangent value to a industry that consumers and Wall Street analysts naturally understand. Consumers can see more personalized marketing, which will boost sales.
An effort to provide more value may even challenge that consumer nick-name "Whole Paycheck” nickname.
This scenario is an analytical environment that can benefit Whole Foods against fierce competitors like Target and Wal-Mart, which are already using analytic initiatives of their own.
The decision to acquire a company is no small feat - Amazon’s all-cash acquisition is its largest to date. But this news places a strategy spotlight on the value of analytics.
Amazon’s growth, albeit with debate about its scale at its start, reflects a trend that scaling a business profitably is part of business growth. Business leaders are beginning to understand analytics can become a factor for unlocking long term value. More importantly, they are putting that understanding into action.
The growing appreciation also raises the question - should a business look to acquire a business with analytics capability or should it develop its own in-house analytic services? This dilemma is a significant twist from a classic business question - to develop in-house capability or to integrate another company capabilities that has been honed and refined.
So should companies build software as a response to competitive pressure, or should they acquire it? There is no panacea for an answer.
Many business owners believe business growth means increasing in physical size. But doing so increases the demand for capital, and can start a never-ending spiral to induce volume sales.
Analytics can provide the right approach to scale, a variation on Immelt’s thought regarding self-disruption. But it can take a large costly and timely effort to implement the right solutions.
But no matter what choice managers make, companies have to analyze their strategic activity and determine how to best create solutions that customers appreciate.

Boston traffic is a great metaphor for traffic flow, but for digital, you must make plans to make that traffic happen. Social media is perfect for those plans.
One concept is a crucial aspect in business today - the idea that the team that manages all its sources of value has a significant advantage. Those resources are become digitalized, represented as data.
The end result is that analytics becomes central in building a strategic advantage. For probably the most dramatic example of what analytics can potentially do, check out my CMSWire post on the Amazon-Whole Foods merger. The grocery retail industry has operated on thin margins. Whole Foods Market has been the noted exception for years, thanks to its emphasis on organic foods. Organic foods have traditionally carried a higher price, so its contribution margin is higher than common goods.
But during 2016, Whole Foods saw competitors begin to also offer organic foods. The most notable is Wal-Mart. Wal-Mart has offered groceries at lower prices, putting earning pressure on Whole Foods. It experienced 6 financial quarters of declining earnings, due in part to the increased competition.
Analytics can not fix a bad business model, but it can make an effective one better. Whole Foods has an effective model, and Amazon's ability to leverage wholistic analytics on its cloud technology and operations can offer new ways to Whole Foods to cut costs where possible.
--Pierre DeBois
Segmentation has always been the raison d’être for analyzing data. After all, analytics is greek for “breakdown”, and businesses are trying to breakdown data into segments that can reveal ideas to serve customers easily. Understanding data segments reveal the kind of customers who are discovering your online media…and thus, discovering if your business is a good one to do business with.
But when it comes to data segments created from traffic sources to a site or app, mobile data drives the heart of the analysis especially if there is an Internet of Things influence in the strategy, such as beacons in a retail location.
So how can a business direct its analysis to make an IoT strategy better?
The best answer comes from combining Affinity reports and second dimension to know where people are coming from when they arrive to your site and to learn how people journey in general.
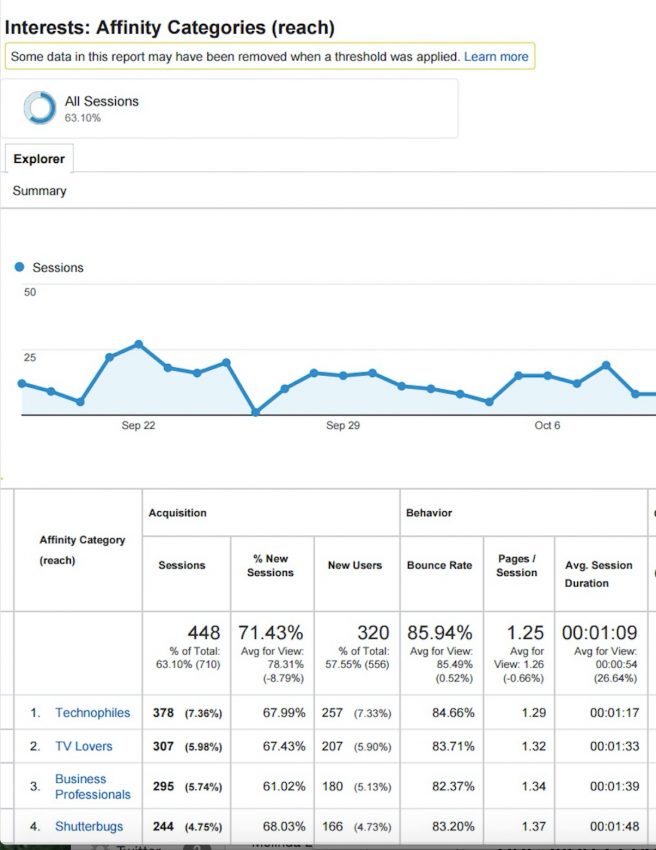
Affinity reports are useful in discovering new sites and topics that customers hold an interest.The Affinity and In-Market Reports offer lifestyle (Affinity) and purchase-intent (In-Market) topics that attracted an audience to a measured site or app.
But sometimes reviewing Affinity report results on one dimension does not reveal a pattern or a trend that tells the user something meaningful. Selecting a relevant second dimension can help reveal more information to help the user see a pattern and make decisions. (This Zimana post talks about second dimension selection in more detail.)
So where to start first?
Go to an Affinity Report and determine what topics are typically of interest to your site traffic.
Next set the Second Dimension in Affinity Reports to one of the following, based on the purpose of what associated information appears with the results in the Affinity Report:
Device
Time
Age Range
Verifying attribution can help you see if your media usage is in step with an target audience or within your industry. You can do so with the Google Customer Journey Tool (I explain how the tool works in my CMSWire post - Pierre). The purpose of the tool is to see how customers general use different channels in a sequence before they purchase.

Zimana founder Pierre DeBois was featured in Chicago Sun Times
Our friends at Small Business Trends had a great idea for an infographic - note what customers want from an app. That idea is shown below, with a number of themes on how an app serves customer needs.
Many business launch an app, but not sure how to integrate the app's purpose into a cohesive strategy or business model. reviewing the tips on this infographic should spark ideas as to how to improve your strategy or business model with an app.

This infographic first appeared in Small Business Trends.