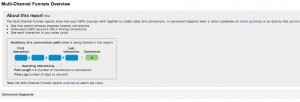
This Google Analytics feature for Multichannel shows the number of assists that can occur in a path. This kind of reporting can assist e-commerce sites in understanding how their digital marketing and social media is impacting their online sales (image: Google Analytics)
Reporting on E-commerce related analytics is more specialized than most other analytic reporting requests. The reports tie visits and associated metrics to the products and services offered on your website. But the complexity of adding a number of details, such as SKU information, increases the number of reporting segments that can influence conversions. This increase can feel daunting if time is of the essence for your business (and when is it ever not?!!)
To have some at-a-glance performances for setting up a dashboard, retailers should consider the following metrics as a starting point to quickly assess the health of their business:
When developing reporting ideas to monitor, consider segmentation based on how your point of sales are organized. Segments that can be developed for e-commerce include top selling items by quantity and top selling items by sources.
Also consider speed to purchase. Reports that can reveal metrics such as "visits to purchase" and "days to purchase" are valuable in determining how quickly purchases are being conducted.
Another "speed" report is multichannel marketing reports to show how many "assists" are occurring to begin a sales transaction. The more assists means a potentially lengthy time to gain a sale. It may mean opportunities to use ad techniques such as remarketing to help "shorten" the sales cycle.
In fact, multiple actions are typical for an e-commerce site, given the number of items made available. Thus the value of e-commerce goals set in Google Analytics reporting differs from goal setting in the admin by representing both a conversion in a visit or actions associated with a visit.
No matter what analytic solution you use, always verify how conversions are recorded. This may yield analysis insights regarding the speed and volume purchases are made from marketing online.