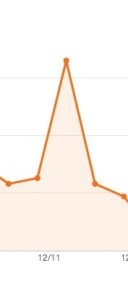
You just got your first cup of coffee when you sit down, crack open an analytics report, and see… a blip...a true-to-life spike in your data trend.
What does that spike mean?
Some managers may see a spike as a positive response to content online or a marketing campaign. But before you go a'celebratin' that increase in traffic, make sure that the increase is due to meaningful changes from your traffic sources.
Consider the following 5 ideas as a great starting point to guide you to a decision if the data is telling you something significant or if it is a blip along the way to improving your digital presence.
- Did the spike influence the volume of goals completed? This is the first question to ask. Asking and answering this question determines if a deep dive into the reports are necessary in the first place. Examine the conversion rates prior to and after the spike event to gain some indication of how significant the influence really is to your site objectives.
- Determine the time period of the spike, and then examine the time on site metrics (Note: Google changed the name of this metric to average session duration). Examine the time metric against visitor volume. The average session duration can decline slightly when there is a high volume of visits - the law of averages implies that there are more chances for a short visit. But the decline should not be extraordinarily low compared to the volume, such as an average session duration (ASD) of 10 sec from, say, 500 sessions. Low ASD compared to session volume implies that bots created some of the sessions. Examine and note if there is more than a 10-15% decline in average time on site/average session duration.
- If the spike appears periodically, consider using a packet sniffer to examine how web elements are being called - it can reveal if bots are appearing periodically to artificially inflate your traffic volume. The packet sniffers available have been mentioned in this Zimana blog post (insert post). Google Analytics also offers a filter in its analytics package to remove bots from its reports.
- Review referral sources to see if there is an influence from a new source. Compare this against your intention of a marketing strategy - are these sites intended or are they something else? Inspect to see if the referral sources are legitimate sites, and not spam.
- Once identified, verify that some of the traffic that remained after the spike has value. Do a comparison of traffic conditions before and after the spike, using data with a 20 - 30 day range as a simple starter. The point is to see if the spike, despite a drop, continued from the source and has some retention of visitors. Consider examining if there is a change in the percentage of returning visitor sessions or goals completions.
[…] You just got your first cup of coffee when you sit down, crack open an analytics report, and see… a blip, spike in your data trend. […]
[…] What Does A Data Spike in Analytics Report Mean – 5 Suggestions by Pierre DeBois […]
[…] What Does A Data Spike in Analytics Report Mean – 5 Suggestions by Pierre DeBois […]
[…] What Does A Data Spike in Analytics Report Mean – 5 Suggestions by Pierre DeBois […]
[…] What Does A Data Spike in Analytics Report Mean – 5 Suggestions by Pierre DeBois […]
[…] What Does A Data Spike in Analytics Report Mean – 5 Suggestions by Pierre DeBois […]
[…] What Does A Data Spike in Analytics Report Mean – 5 Suggestions (by Pierre […]
[…] What Does A Data Spike in Analytics Report Mean – 5 Suggestions by Pierre DeBois […]